There are no items in your cart
Add More
Add More
| Item Details | Price | ||
|---|---|---|---|

"A beginner friendly walkthrough of the July 1, 2026 Regime Report"
Before we look at what happened in the bond market this week, you need three simple ideas in place. Once you have these, the whole report will click.
When a government borrows money by selling a bond, it promises to pay the lender back later, plus some interest. That interest rate is called the yield. If you buy a 10 year US Treasury bond, the yield tells you the annual return you get for lending your money to the US government for 10 years.
Yields move up and down every day based on how much investors want to lend, and how much the government needs to borrow. Higher yield usually means investors want more compensation to hand over their money for that long.
A yield curve is simply a line connecting the yields of different maturities, short term bonds on one end, long term bonds on the other. In normal healthy conditions, longer term bonds pay a bit more than short term bonds, because tying up your money for longer feels riskier. This is called a positively sloped curve.
When short term yields rise above long term yields, the curve flips. This is called an inverted curve, and it usually signals that markets expect trouble ahead, often a slowdown or a rate cut cycle. When the curve returns to its normal positive slope, as it just did in this report, it tells you something has shifted in how investors see the future.
This is the concept most new students skip past, and it is the entire point of this week's report.
Term premium is the extra return investors demand to hold a long term bond instead of a series of short term ones. Two things drive it. First, uncertainty. The further into the future a bond matures, the less certain you are about inflation, growth, and policy, so you want to be paid more for that risk. Second, supply and demand. If the government is issuing enormous amounts of long term debt, and there are fewer buyers stepping in to absorb it, investors can demand a higher yield to be convinced to buy.
For a long stretch of the last decade, the Federal Reserve itself was one of the biggest buyers of long term Treasury bonds, through a policy called quantitative easing. That buying suppressed term premium artificially. Investors did not need to demand as much extra yield because they knew a very large, price insensitive buyer was always in the market. Traders nicknamed this backstop the Fed Put, the idea that the Fed would always show up to support bond prices when things got rough.
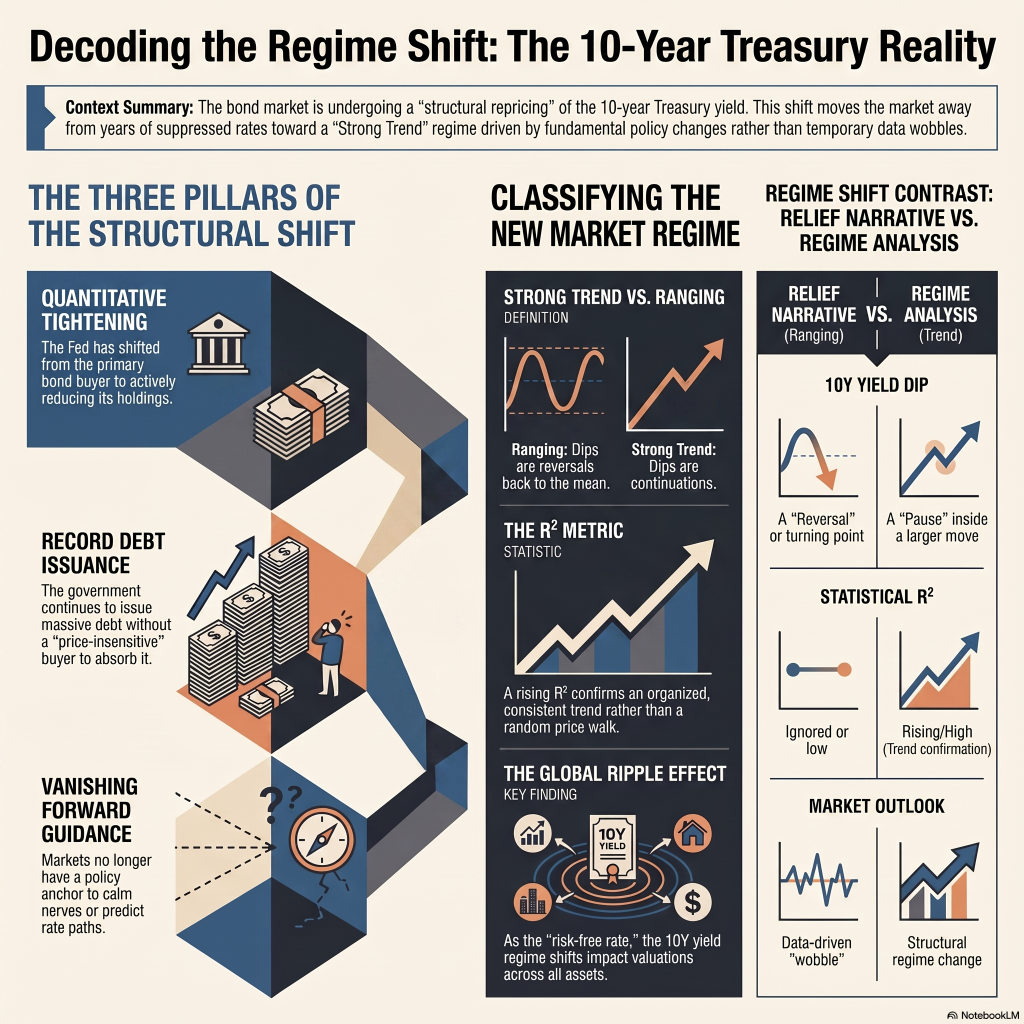
Now picture what happens when that buyer steps back, sells instead of buys, and the government still needs to issue the same enormous pile of debt. The remaining buyers, mostly private investors, pension funds, and foreign governments, need a better reason to hold that duration risk. That better reason is a higher term premium. That is a structural repricing, not a temporary mood swing.
Now the report becomes readable.
The 10 year Treasury yield sat at 4.38 percent, having dipped 7 basis points (a small move) after an inflation reading called core PCE came in at 3.4 percent, well above the Fed's 2 percent target. Most market commentary treated the small dip as relief, as if the worst was behind us.
The report disagrees with that framing, and here is the reasoning worth understanding as a student, not just accepting as an answer.
Three forces are pushing in the same direction at the same time. The Fed is actively reducing its bond holdings instead of buying them, known as quantitative tightening. The government still needs to issue a very large amount of new debt regardless of what the Fed does. And there is no forward guidance anchor telling markets exactly what path rates will take, which used to calm nerves during past cycles.
None of these three forces are temporary news events. They are ongoing structural conditions. A single soft inflation print does not undo them. That is why the report calls this a regime change rather than a data driven wobble.
This is the core teaching concept behind everything MTS students learn, so it is worth slowing down here.
A market regime describes the underlying behavior of a market at a given time, independent of which direction price is moving. Broadly there are two behaviors that matter most for a beginner.
A Strong Trend regime is one where price is moving persistently in one direction with high consistency, and pullbacks tend to resolve by continuing the trend rather than reversing it.
A Ranging or Mean Reverting regime is one where price oscillates between levels, and pullbacks tend to reverse back toward the middle rather than continue.
The tool you should use to trade or interpret a market depends entirely on which regime it is in. Mean reversion tools, buying dips expecting a bounce back to the average, work beautifully in a Ranging regime and lose money reliably in a Strong Trend regime, because in a trend, dips are usually continuation setups, not reversal opportunities.
This is the mistake the report is pointing at. Commentators calling the 7 basis point yield dip a relief rally are applying Ranging regime logic, buy the dip, expect reversion, to a market the report identifies as a Strong Trend regime. If the regime classification is correct, that dip was never a turning point. It was a pause inside a bigger move.
You will see the term R² throughout Regime Report content. In simple terms, it is a statistical measure of how well a straight trend line fits the actual price data over a chosen period, here 63 trading days of 10 year yield closes. A high R² means price has been moving in an unusually clean, organized, consistent direction, which supports calling it a Strong Trend regime. A low R² means price is choppy and directionless, which supports calling it a Ranging regime. The report states R² on the 10 year yield has been climbing steadily all year, which is the statistical backbone behind the Strong Trend classification, not just an opinion.
Every market has its own regime at any given time, and the report also mentions a separate story in USD/JPY this week. But the report draws an important distinction in scale.
A currency pair regime shift mostly affects related trades, carry trades, certain emerging market assets, momentum currency strategies. It matters, but its reach is limited to a defined set of instruments.
The 10 year Treasury yield is different because it functions as the risk free rate, the baseline number used to price almost everything else in the financial system. Growth stock valuations depend on a discount rate built from this yield. Real estate pricing is benchmarked against it. Corporate bond spreads are measured relative to it. Pension obligations are calculated using it. When the regime governing this one number changes, the effect does not stay contained, it ripples through valuation models across every asset class at once.
That is the difference between an interesting regime shift and what the report calls a structural one.
Here is how a student would actually walk through this using the regime framework, step by step, rather than reacting to the headline.
Step one, identify the headline narrative. Financial media framed the week as good news, inflation cooled slightly, yields eased, tension released.
Step two, check what the regime data actually shows. R² on the 10 year yield has been rising through the year, which statistically supports a persistent Strong Trend, not a random walk. The yield curve has also normalized to a positive slope, a structural shift in itself, not a one week blip.
Step three, identify what is driving the trend structurally, not just today's data print. Three ongoing forces were named, active Fed balance sheet reduction, continuous heavy government debt issuance, and the absence of a forward guidance anchor. All three are policy level conditions that persist beyond any single inflation report.
Step four, classify the small pullback correctly. In a confirmed Strong Trend regime, a small dip after one data release fits the profile of a pause or continuation setup far better than a reversal. Treating it as a reversal, and buying duration expecting yields to keep falling, is applying the wrong tool for the regime, exactly the error the framework is built to prevent.
Step five, define the next real decision point. The report is clear that the next meaningful input is not another routine data release, it is the Fed's own task force findings on the pace of balance sheet reduction, expected by year end, and any signal on active bond sales. That is the actual event that could confirm or break the current trend, and it is what a disciplined student would be watching, rather than reacting to every daily headline.
This is the entire discipline in miniature. Not predicting the future, but correctly classifying what regime the present is already in, and choosing tools that match that regime instead of fighting it.
A market can look calm on any single day and still be inside a powerful structural trend underneath. Your job as a student of mechanical trading is never to trade the headline. It is to classify the regime first, and only then choose your tool.

{{Purvang Gandhi - AUTHOR}}
 Launch your Graphy